

Why Liquidity Matters (Without the Hype)
Liquidity is one of the most frequently mentioned and least clearly understood concepts in trading. It is often framed as something price is actively seeking, avoiding, or exploiting. That language can make markets feel intentional or deceptive, when in reality liquidity is simply a description of how easily transactions can occur at different prices.
Understanding market liquidity explained in practical terms helps remove emotion from price movement. Sudden spikes, slow drifts, and sharp pauses are not signals or messages. They are mechanical outcomes of participation and available orders.
Liquidity does not tell you what will happen next. It helps explain why price is behaving the way it is right now.
What Market Liquidity Actually Describes
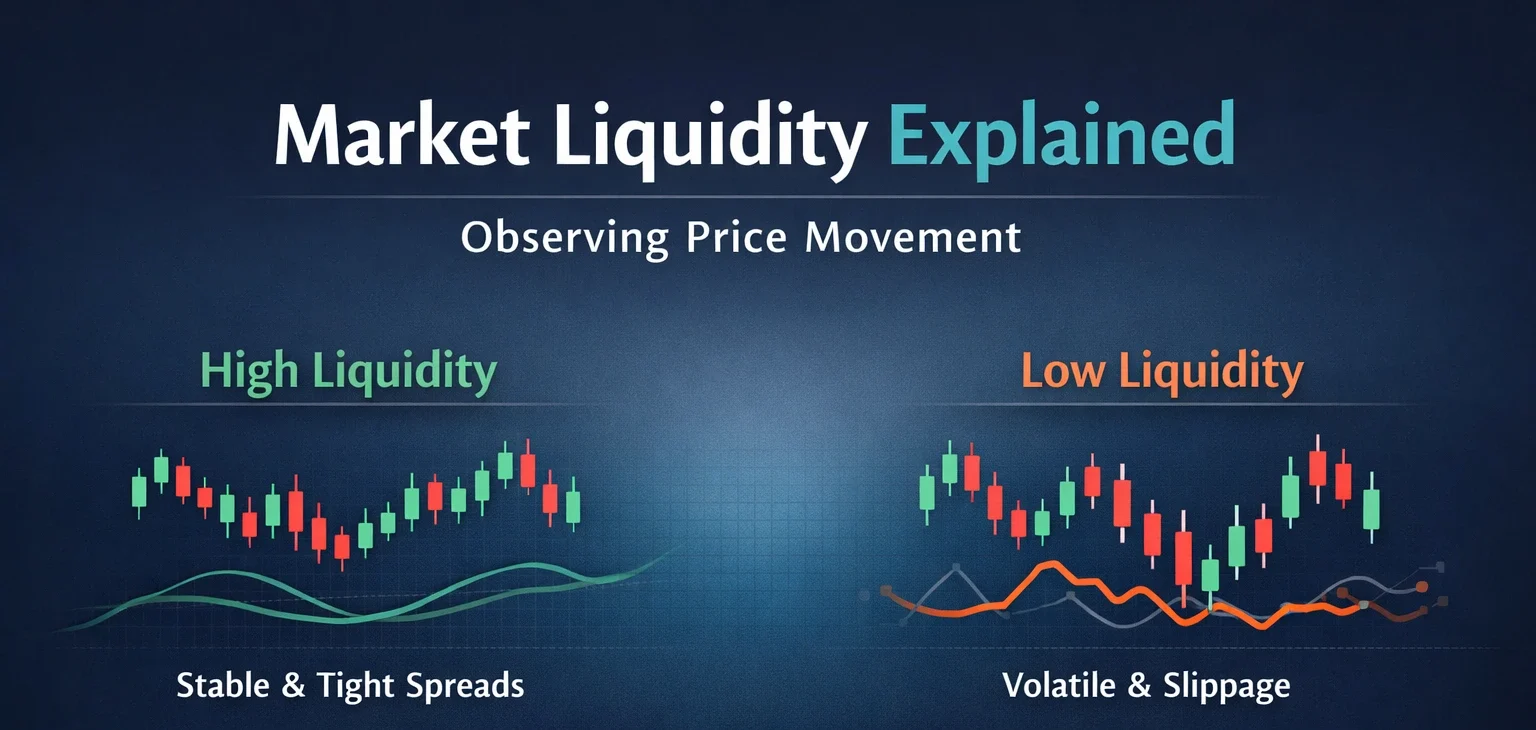
Market liquidity refers to the availability of buyers and sellers willing to transact at or near current prices. When liquidity is high, price can absorb activity with relatively little movement. When liquidity is thin, even modest participation can produce large price changes.

Liquidity is not a fixed property of a market. It varies throughout the trading day, across sessions, and around scheduled or unscheduled events. This is why the same instrument can feel calm at one moment and unstable at another, despite no obvious change in narrative.
This variability is also why price behaviour cannot be interpreted without context. Observing liquidity is about recognising conditions, not identifying opportunities.
How Liquidity Influences Price Movement
Price moves as trades are executed where orders exist. It slows when orders are plentiful and accelerates when they are sparse.
In more liquid conditions, price tends to move smoothly. Progress often appears incremental, with frequent pauses and overlaps. Movement requires sustained participation because orders are continuously absorbing pressure.
In thinner conditions, price can appear aggressive or erratic. Levels may be skipped, and movement can feel exaggerated relative to volume. This is not because more activity is occurring, but because less is needed to move price.
This distinction helps explain why volatility can increase during periods of low participation. Volatility is not always a sign of interest. Sometimes it is simply a reflection of fragility.
Liquidity Versus Volatility
Liquidity and volatility are often treated as interchangeable, but they describe different aspects of market behaviour.
Liquidity relates to how easily trades can be executed without moving price. Volatility describes how much price is actually moving.
A market can be both highly liquid and highly volatile, such as during major session overlaps or high-impact events. It can also be volatile precisely because liquidity is low, where small bursts of activity cause disproportionate movement.
Understanding this difference prevents a common error: assuming that fast movement always reflects strong participation. Sometimes it reflects the opposite.
This concept ties closely into how volatility regimes behave over time, which is explored further in Volatility Regimes Explained for Traders.
Where Liquidity Commonly Builds
Liquidity tends to concentrate around prices where participants have previously interacted. These areas are not magical levels, but references created by repeated engagement.
Recent highs and lows, consolidation zones, and widely observed reference points often attract activity because they are already part of participants’ decision-making frameworks. This does not mean price must reverse or react in a particular way. It simply means more interaction is likely to occur there.
This idea overlaps with how traders commonly interpret support and resistance. When viewed descriptively, these areas represent zones of past participation rather than predictive barriers, a concept discussed in more depth in Understanding Support and Resistance Levels.
Why Price Sometimes Moves Quickly Through Certain Areas
Fast movement through a price region often indicates limited resting orders rather than urgency or intent. When there is little liquidity between areas of prior interaction, price can travel quickly until it encounters more active participation.
These movements can feel dramatic, but they are often mechanically simple. One-sided participation meets little opposition, and price adjusts rapidly to find the next area where orders exist.
Once price reaches a region with greater liquidity, its behaviour often changes. Movement may slow, overlap increases, or volatility compresses. These shifts are not predictions of reversal or continuation. They are real-time responses to changing conditions.
Liquidity in a Descriptive Trading Framework
Within a safe, educational approach, liquidity is used to explain observed behaviour rather than anticipate outcomes.
Observing liquidity can help clarify why price moved faster in one session than another, why certain periods feel more stable, or why similar patterns behave differently across time.
It does not answer where price will go next, whether a level will hold, or when a move will end. Expecting liquidity to provide those answers leads to frustration and over-interpretation.
This perspective aligns with the broader Tick Flow philosophy that indicators and concepts are descriptive tools, not predictive devices, as outlined in Why Indicators Don’t Predict Price (And What They’re Actually Useful For).
Common Misinterpretations Around Liquidity
Liquidity is frequently described using metaphors such as hunting or seeking. While these narratives are popular, they can obscure what is actually happening.
Price does not search for liquidity. Participants place orders, and trades occur where those orders exist.
Another common misunderstanding is assuming that high liquidity guarantees stability. High liquidity allows markets to absorb activity more efficiently, but it does not prevent movement. It changes the character of movement, not its direction or inevitability.
Final Thoughts
Understanding market liquidity explained through a descriptive lens removes much of the mystery traders attach to price movement.
Liquidity helps explain differences in speed, smoothness, and behaviour across sessions and environments. It provides context for why markets feel different at different times without assigning intention or prediction.
When liquidity is treated as a condition rather than a signal, price action becomes easier to interpret and less emotionally charged. The market stops feeling personal, and analysis becomes grounded in observable behaviour.
This content is provided for educational purposes only and reflects a descriptive analysis of market behaviour. It does not constitute financial advice, investment recommendations, or an invitation to trade any financial instrument.
All concepts discussed are used to describe historical and current market conditions. No methodology guarantees outcomes or predicts future market movements. Trading and investing involve risk, and past performance is not indicative of future results. You are solely responsible for any decisions you make based on this information.


