• About
  • Privacy & Policy
  • Contact
Tick Flow
Advertisement
  • Mindset
  • Market Behaviour
  • Indicators
  • Tools
    • Trade Simulator
    • Lot Size Calculator
    • TradingView
No Result
View All Result
  • Mindset
  • Market Behaviour
  • Indicators
  • Tools
    • Trade Simulator
    • Lot Size Calculator
    • TradingView
No Result
View All Result
Tick Flow
No Result
View All Result

Trend Development Explained: Observing Market Structure

by DukeOnTheCharts
in Market Behaviour
Trend Development Explained: Observing Market Structure

Understanding Trend Development in Trading

Trends are a fundamental aspect of market behaviour. Recognizing how they form and develop allows traders to observe price action more clearly. This article explains trend development using higher highs and lower lows in a descriptive, educational manner.

How Trends Form

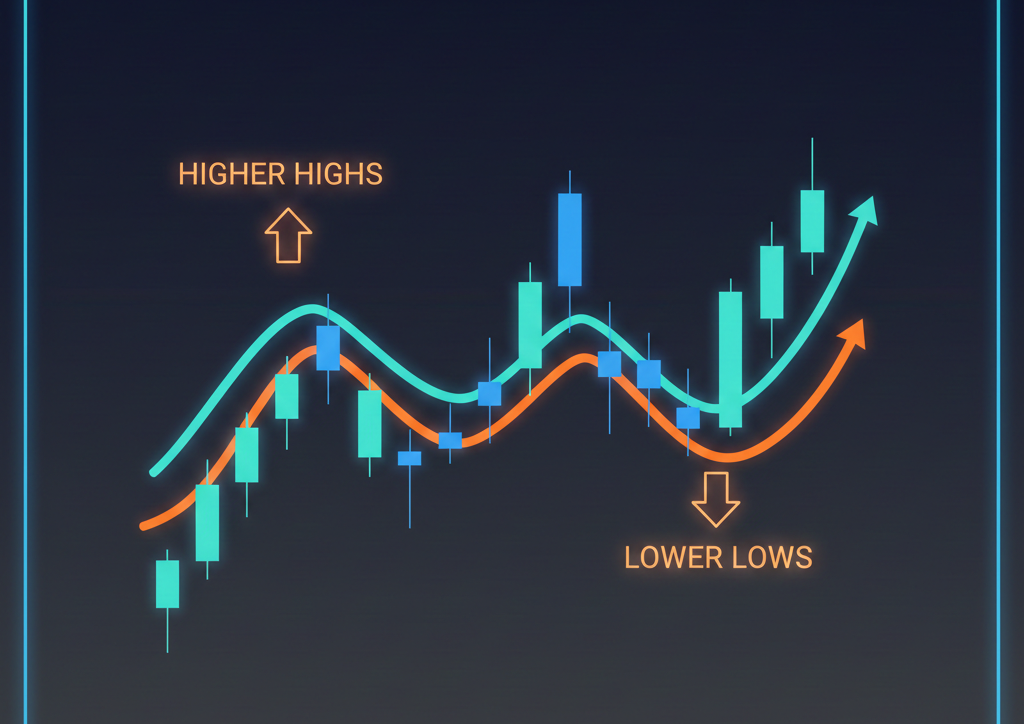
A trend develops when price consistently moves in one direction, creating a series of recognizable patterns. An uptrend occurs when successive peaks are higher than the previous ones (higher highs) and successive troughs are also higher than prior lows. Conversely, a downtrend forms when price generates lower lows and lower highs.

By observing these patterns, traders gain insight into market momentum and the relative strength of buying or selling pressure, without predicting future outcomes.

Observing Higher Highs and Lower Lows

Identifying higher highs and lower lows involves looking at recent price swings within a market structure. In an uptrend, each new high surpasses the previous high, and each low remains above the prior low. In a downtrend, each new low dips below the previous low, while each high remains lower than the previous peak.

This descriptive method focuses on past and present market behaviour, helping traders understand trend development rather than forecast price direction.

Maintaining Context

Trends exist within broader market conditions. Observing them in context ensures accurate interpretation. For instance, a series of higher highs may occur within a larger sideways market, indicating short-term momentum rather than a full-scale uptrend. Similarly, volatility and support/resistance levels influence trend perception.

Understanding trends as descriptive tools allows traders to frame probabilities and market patterns without assuming certainty.

Common Misconceptions

Many traders assume that identifying a trend guarantees future price movement. In reality, trends describe what has already happened. Misinterpreting patterns or forcing predictions based on past highs and lows can lead to poor analysis. Focus on observation and context instead of outcomes.

Final Thoughts

Trend development, through higher highs and lower lows, provides a descriptive framework for understanding market structure. By observing these patterns, traders can gain insight into momentum and market behaviour in an educational and non predictive manner.

This approach to observing trend development aligns with insights from our earlier article, “Understanding Support and Resistance Levels,” where market structure and key price levels are explored in a descriptive, educational framework.

Trading financial markets involves risk and may not suit all investors. Tick Flow content is for educational purposes only and does not constitute financial advice. Past performance does not indicate future results. Nothing in this article should be considered a recommendation to trade or invest.

ShareTweet
Previous Post

Consistent Trading Routine Explained

Next Post

Momentum vs Trend Indicators Explained for Traders

Next Post
Momentum vs Trend Indicators Explained for Traders

Momentum vs Trend Indicators Explained for Traders

  • Trending
  • Comments
  • Latest
Why Trading Simulators Help Traders Understand Risk, Probability, and Losing Streaks

Why Trading Simulators Help Traders Understand Risk, Probability, and Losing Streaks

December 30, 2025
Why Trading Is a Game of Probabilities, Not Predictions

Why Trading Is a Game of Probabilities, Not Predictions

December 30, 2025
Why Consistency Feels Harder Than It Actually Is

Why Consistency Feels Harder Than It Actually Is

December 30, 2025
How Moving Averages Really Work

How Moving Averages Really Work

January 15, 2026
Understanding Support and Resistance Levels

Understanding Support and Resistance Levels

4
RSI Explained: Momentum, Not Overbought and Oversold

RSI Explained: Momentum, Not Overbought and Oversold

3
Why Consistency Feels Harder Than It Actually Is

Why Consistency Feels Harder Than It Actually Is

2
Why Indicators Don’t Predict Price (And What They’re Actually Useful For)

Why Indicators Don’t Predict Price (And What They’re Actually Useful For)

2
Market Behaviour Across Timeframes

Market Behaviour Across Timeframes

March 4, 2026
How Moving Average Crossovers Provide Context

How Moving Average Crossovers Provide Context

March 2, 2026
Understanding Overtrading and Psychology

Understanding Overtrading and Psychology

February 7, 2026
Market Behaviour During High Volatility Periods

Market Behaviour During High Volatility Periods

February 4, 2026
  • About
  • Privacy & Policy
  • Contact
Some links on this page may be affiliate links. This means we may earn a commission at no additional cost to you.

© 2025 Tick Flow. All rights reserved. The information and tools on this website are provided for educational and informational purposes only and do not constitute financial, investment, or trading advice. Tick Flow does not provide personalized recommendations, and any opinions expressed are general in nature and intended to support learning and discussion. Trading and investing involve significant risk, and you are solely responsible for your own decisions. Always conduct your own research before making any financial decisions. The tools provided, including the Trade Simulator, are for practice and educational use only and do not involve real-money trading. Tick Flow is not authorized or regulated by the Financial Conduct Authority (FCA) and this website does not constitute an offer or solicitation to buy or sell any financial instrument.

Welcome Back!

Login to your account below

Forgotten Password?

Retrieve your password

Please enter your username or email address to reset your password.

Log In
No Result
View All Result
  • Mindset
  • Market Behaviour
  • Indicators
  • Tools
    • Trading Simulator
    • TradingView
    • Lot Size Calculator

© 2025 Tick Flow. All rights reserved. The information and tools on this website are provided for educational and informational purposes only and do not constitute financial, investment, or trading advice. Tick Flow does not provide personalized recommendations, and any opinions expressed are general in nature and intended to support learning and discussion. Trading and investing involve significant risk, and you are solely responsible for your own decisions. Always conduct your own research before making any financial decisions. The tools provided, including the Trade Simulator, are for practice and educational use only and do not involve real-money trading. Tick Flow is not authorized or regulated by the Financial Conduct Authority (FCA) and this website does not constitute an offer or solicitation to buy or sell any financial instrument.

We use cookies to ensure the proper functioning of this website and to enhance your experience. By continuing to use this site, you consent to our use of cookies. For more information, please see our Privacy and Cookie Policy.